


- %3Cp%3E%3Cbr%3E%3C/p%3E
- %3Cp%3E%3Cspan%20style%3D%22font-size%3A%2013px%3B%22%3EScroll%20down%20to%20view%20more%20details%20on%20the%20anomolies%3C/span%3E%3C/p%3E
- View anomalies
- Config deviation
- Node status
- End of the clickthrough
- %3Cp%3E%3Cbr%3E%3C/p%3E
- %3Cp%3E%3Cspan%20style%3D%22font-size%3A%2013px%3B%22%3EScroll%20down%20to%20view%20more%20details%20on%20the%20anomolies%3C/span%3E%3C/p%3E
- View anomalies
- Config deviation
- Node status
- End of the clickthrough
- %3Cp%3E%3Cbr%3E%3C/p%3E
- %3Cp%3E%3Cspan%20style%3D%22font-size%3A%2013px%3B%22%3EScroll%20down%20to%20view%20more%20details%20on%20the%20anomolies%3C/span%3E%3C/p%3E
- View anomalies
- Config deviation
- Node status
- End of the clickthrough
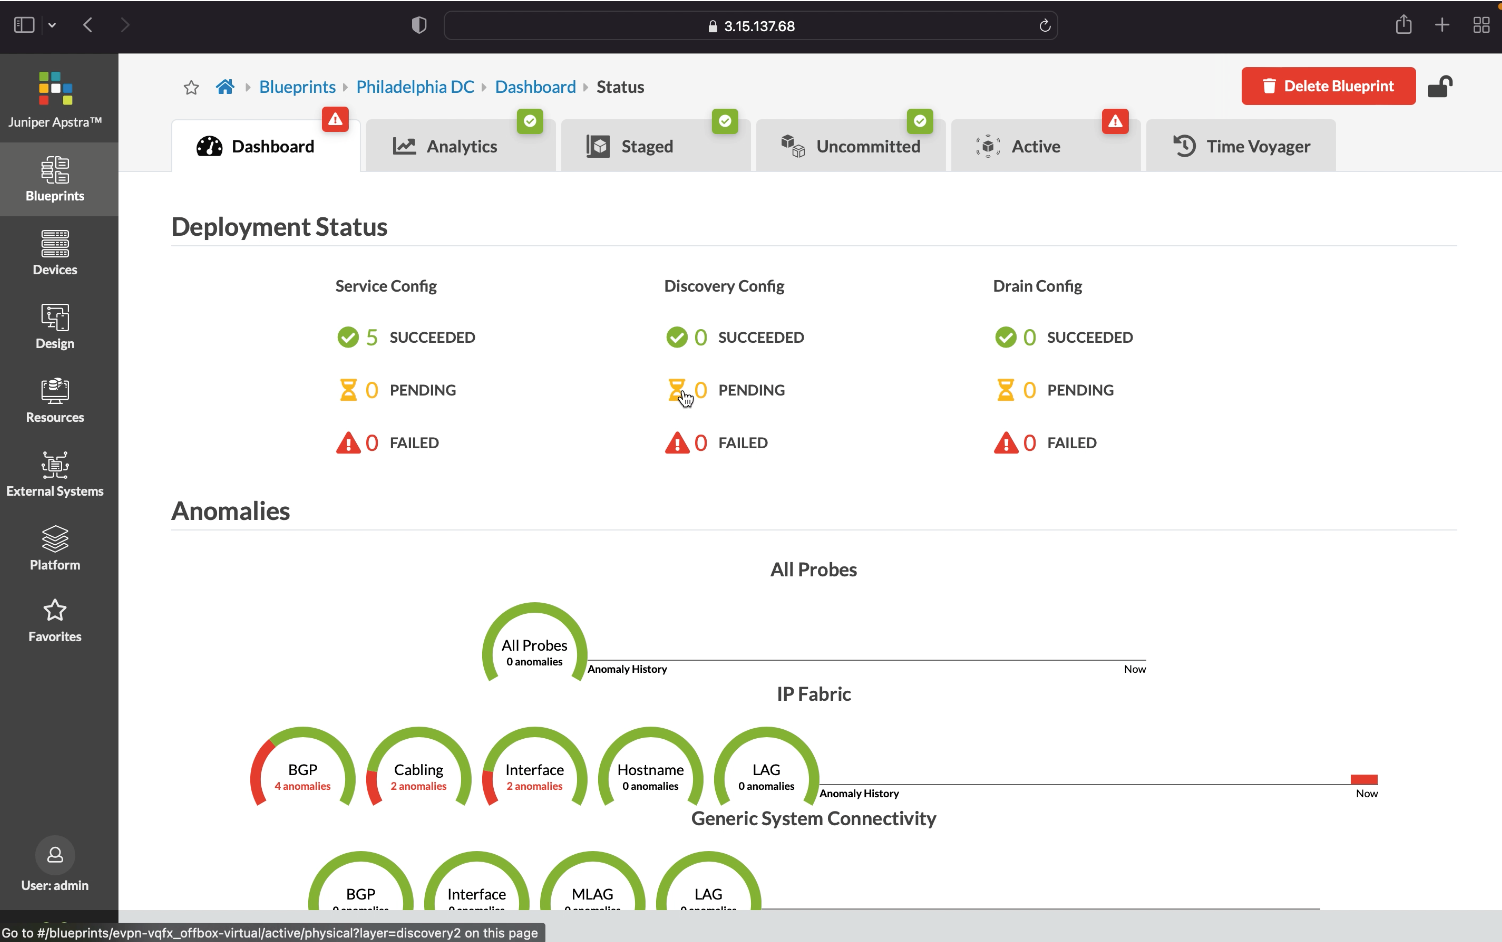
Active: This is where we can view fabric's active operations and telemetry information.
Time Voyager: We can roll back network configuration automatically restore previous revisions of the network blueprint
Staged: This is where the administrator can enact a new configuration
Uncommited: This is where the administrator can enact a new configuration
Service configuration is any configuration that we create in our fabric, including new virtual networks or VRFs. We can quickly view the status of those configurations
A discovery configuration is any basic configuration such as LLDP
A drain configuration displays the configuration status as if we were putting a device into maintenance mode that is draining traffic away from it in order to replace it or upgrade it.
- %3Cp%3E%3Cbr%3E%3C/p%3E
- %3Cp%3E%3Cspan%20style%3D%22font-size%3A%2013px%3B%22%3EScroll%20down%20to%20view%20more%20details%20on%20the%20anomolies%3C/span%3E%3C/p%3E
- View anomalies
- Config deviation
- Node status
- End of the clickthrough
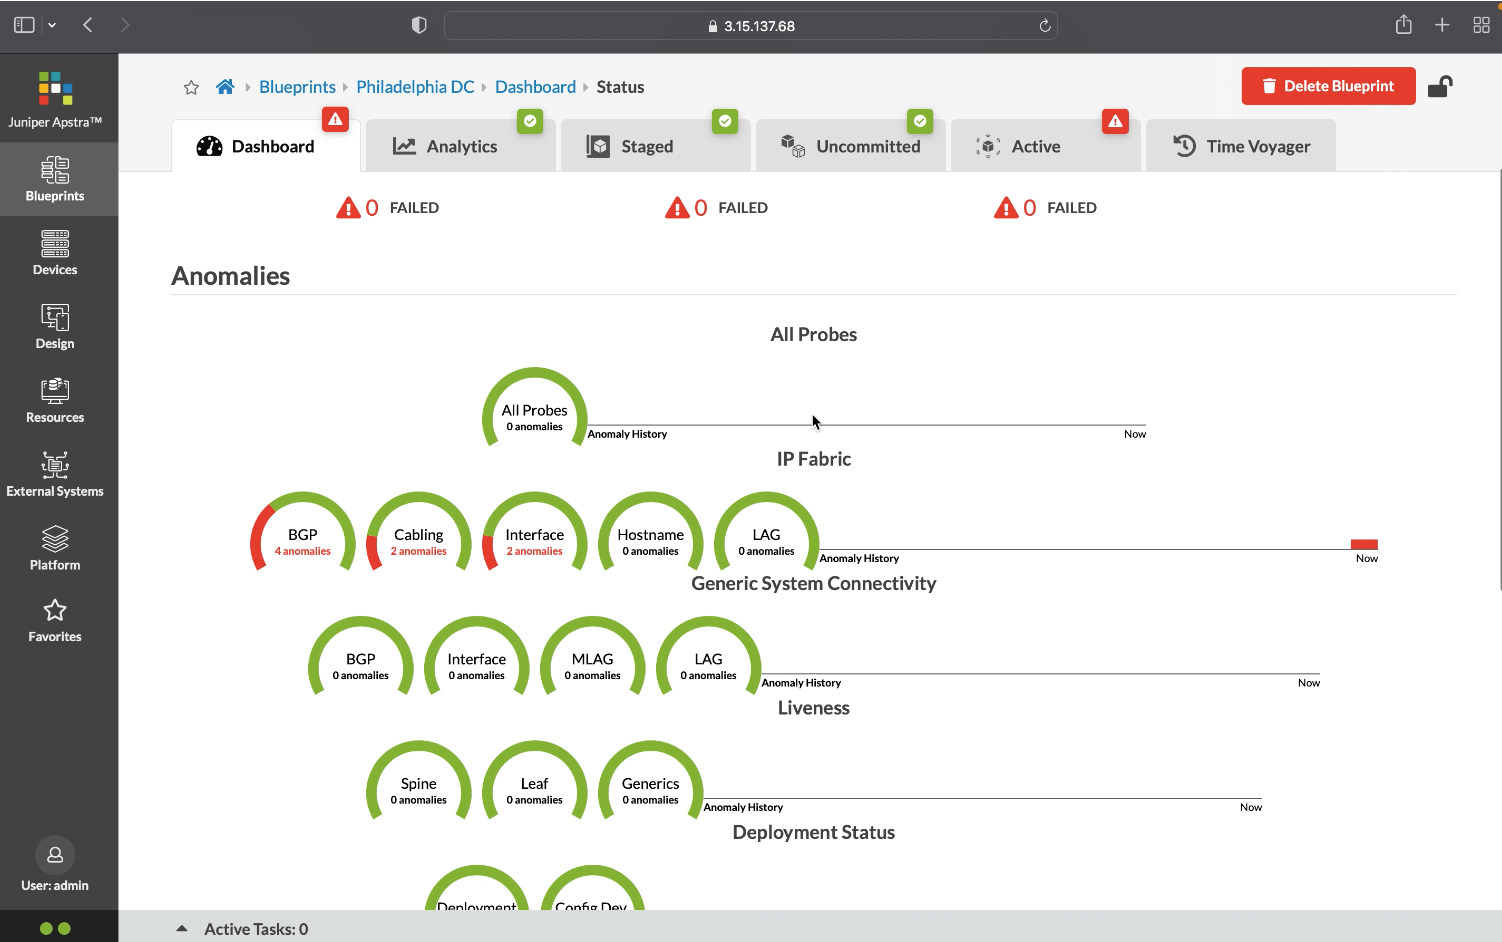
We have disabled an interface on one of the spine devices to intentionally create some anomalies. And we can see, Apstra keeps track of our config in it's graph database, which is the single source of truth.
- %3Cp%3E%3Cbr%3E%3C/p%3E
- %3Cp%3E%3Cspan%20style%3D%22font-size%3A%2013px%3B%22%3EScroll%20down%20to%20view%20more%20details%20on%20the%20anomolies%3C/span%3E%3C/p%3E
- View anomalies
- Config deviation
- Node status
- End of the clickthrough
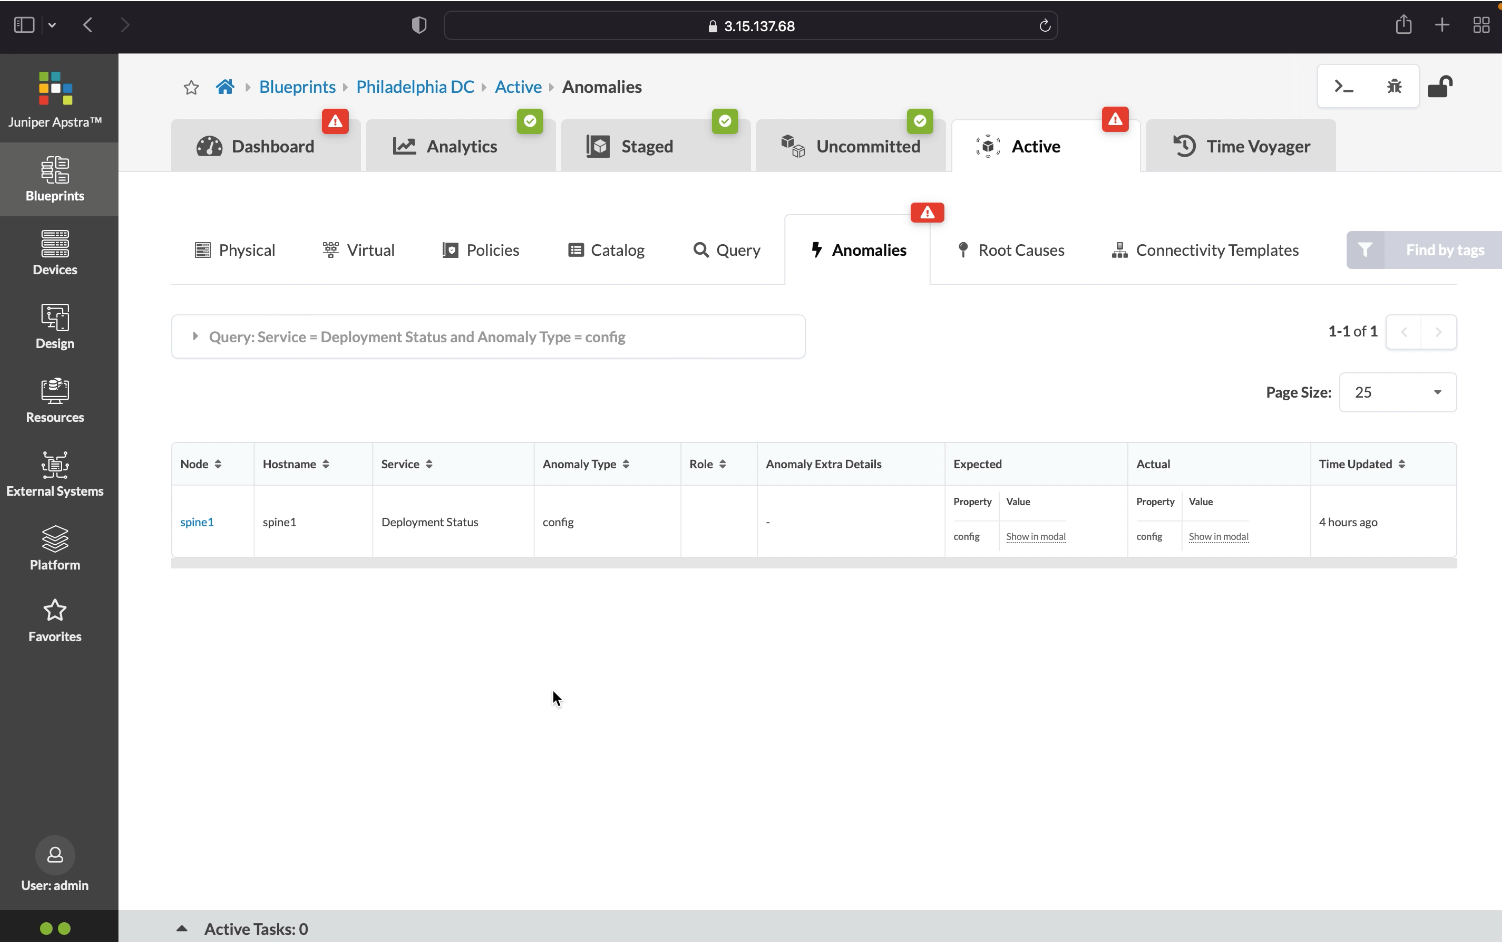
Here are the configuration deviation details that are readily available to us at our fingertips
- %3Cp%3E%3Cbr%3E%3C/p%3E
- %3Cp%3E%3Cspan%20style%3D%22font-size%3A%2013px%3B%22%3EScroll%20down%20to%20view%20more%20details%20on%20the%20anomolies%3C/span%3E%3C/p%3E
- View anomalies
- Config deviation
- Node status
- End of the clickthrough
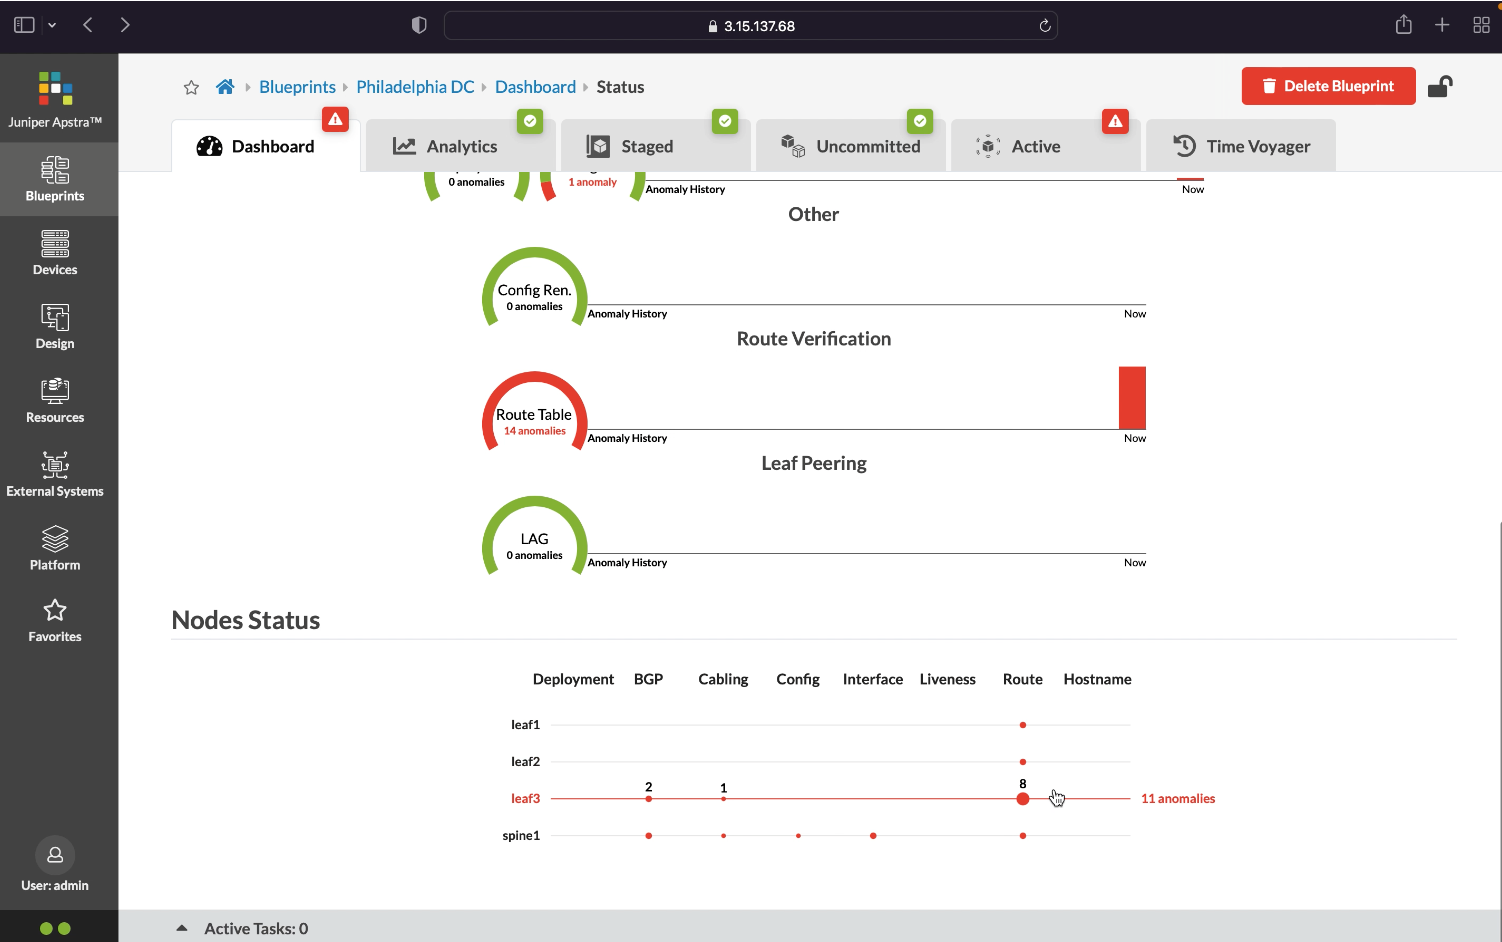
The node status can be described as a blast radius indicator. We have multiple anomalies on spine and we can see how the effect of disabling an interface on one particular spine trickles down and affects the other devices in the fabric
- %3Cp%3E%3Cbr%3E%3C/p%3E
- %3Cp%3E%3Cspan%20style%3D%22font-size%3A%2013px%3B%22%3EScroll%20down%20to%20view%20more%20details%20on%20the%20anomolies%3C/span%3E%3C/p%3E
- View anomalies
- Config deviation
- Node status
- End of the clickthrough
